You gentlemen (yes, even the mountain men) stirred my curiosity about the accuracy of the forecasts.
It depends on where you live. There are some locations that lend themselves to great accuracy and some are much complex and difficult to forecast. Overall, it looks pretty good.
Ron
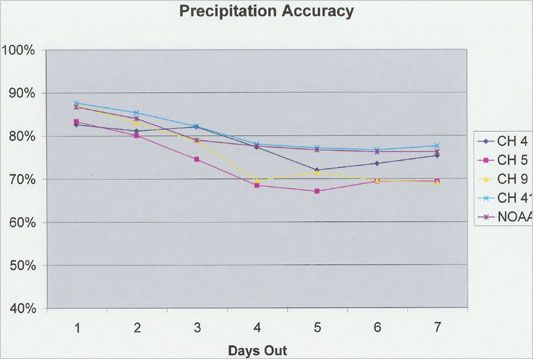
Here are some results from Kansas:
"A seven-month study of weather forecasting at Kansas City television stations was conducted over 220 days, from April 22 to November 21, 2007. The seven-day forecasts for both high temperature and P.O.P. (probability of precipitation) for each station’s 10 p.m. telecast and from the N.O.A.A.
Web site were recorded. For stations that did not offer a P.O.P. in the form of percent likelihood, the best impression of percent likelihood that could be inferred from the meteorologists’ words and graphics were used. The results of Kansas City’s high temperature and rainfall as reported at the K.C.I. airport weather station — which are the data that become the official record for weather at Kansas City — were also recorded. Those results were then compared to the high temperature and P.O.P. predictions to determine forecasting accuracy for each source for each of the seven days predicted."
This is for the primary weather forecast sources:
And finally, for Denver, CO, a particularly difficult place for predictions beyond a day or two:
Weather forecast accuracy for Denver, Colorado
The overall accuracy percent is computed from the one- to three-day out accuracy percentages for high temperature, low temperature, icon forecast precipitation (both rain and snow), and text forecast precipitation (both rain and snow). Temperature accuracy is the percentage of forecasts within three degrees. Precipitation accuracy is the percentage of correct forecasts. The forecasts are collected in the evening.
<table class="MsoNormalTable" style="mso-cellspacing:0in;mso-yfti-tbllook:1184;mso-padding-alt:0in 0in 0in 0in" border="0" cellpadding="0" cellspacing="0"><tr style="mso-yfti-irow:0;mso-yfti-firstrow:yes"><td style="padding:0in 0in 0in 0in" colspan="2">
Last Month
</td></tr><tr style="mso-yfti-irow:1"><td style="padding:0in 0in 0in 0in">
National Weather Service </td><td style="padding:0in 0in 0in 0in">
73.81%</td></tr><tr style="mso-yfti-irow:2"><td style="padding:0in 0in 0in 0in">
AccuWeather </td><td style="padding:0in 0in 0in 0in">
72.32%</td></tr><tr style="mso-yfti-irow:3"><td style="padding:0in 0in 0in 0in">
MeteoGroup </td><td style="padding:0in 0in 0in 0in">
71.73%</td></tr><tr style="mso-yfti-irow:4"><td style="padding:0in 0in 0in 0in">
Foreca </td><td style="padding:0in 0in 0in 0in">
71.43%</td></tr><tr style="mso-yfti-irow:5"><td style="padding:0in 0in 0in 0in">
Weather Underground </td><td style="padding:0in 0in 0in 0in">
69.35%</td></tr><tr style="mso-yfti-irow:6"><td style="padding:0in 0in 0in 0in">
The Weather Channel </td><td style="padding:0in 0in 0in 0in">
69.05%</td></tr><tr style="mso-yfti-irow:7"><td style="padding:0in 0in 0in 0in">
WeatherBug </td><td style="padding:0in 0in 0in 0in">
67.94%</td></tr><tr style="mso-yfti-irow:8"><td style="padding:0in 0in 0in 0in">
CustomWeather </td><td style="padding:0in 0in 0in 0in">
66.37%</td></tr><tr style="mso-yfti-irow:9"><td style="padding:0in 0in 0in 0in">
Dark Sky (forecast.io) </td><td style="padding:0in 0in 0in 0in">
60.12%</td></tr><tr style="mso-yfti-irow:10;mso-yfti-lastrow:yes"><td style="padding:0in 0in 0in 0in">
Persistence </td><td style="padding:0in 0in 0in 0in">
50.00%</td></tr></table>
<table class="MsoNormalTable" style="mso-cellspacing:0in;mso-yfti-tbllook:1184;mso-padding-alt:0in 0in 0in 0in" border="0" cellpadding="0" cellspacing="0"><tr style="mso-yfti-irow:0;mso-yfti-firstrow:yes"><td style="padding:0in 0in 0in 0in" colspan="2">
Last Year
</td></tr><tr style="mso-yfti-irow:1"><td style="padding:0in 0in 0in 0in">
The Weather Channel </td><td style="padding:0in 0in 0in 0in">
71.99%</td></tr><tr style="mso-yfti-irow:2"><td style="padding:0in 0in 0in 0in">
MeteoGroup </td><td style="padding:0in 0in 0in 0in">
71.93%</td></tr><tr style="mso-yfti-irow:3"><td style="padding:0in 0in 0in 0in">
WeatherBug </td><td style="padding:0in 0in 0in 0in">
71.00%</td></tr><tr style="mso-yfti-irow:4"><td style="padding:0in 0in 0in 0in">
Foreca </td><td style="padding:0in 0in 0in 0in">
69.99%</td></tr><tr style="mso-yfti-irow:5"><td style="padding:0in 0in 0in 0in">
Weather Underground </td><td style="padding:0in 0in 0in 0in">
67.84%</td></tr><tr style="mso-yfti-irow:6"><td style="padding:0in 0in 0in 0in">
AccuWeather </td><td style="padding:0in 0in 0in 0in">
67.15%</td></tr><tr style="mso-yfti-irow:7"><td style="padding:0in 0in 0in 0in">
National Weather Service </td><td style="padding:0in 0in 0in 0in">
65.04%</td></tr><tr style="mso-yfti-irow:8"><td style="padding:0in 0in 0in 0in">
CustomWeather </td><td style="padding:0in 0in 0in 0in">
63.80%</td></tr><tr style="mso-yfti-irow:9;mso-yfti-lastrow:yes"><td style="padding:0in 0in 0in 0in">
Persistence </td><td style="padding:0in 0in 0in 0in">
49.17%
</td></tr></table>